Coastdown Testing

HomeCoastdown Testing


Effective aerodynamics is an essential part of overall vehicle design and manufacturers can assess developments to the aerodynamics of their vehicles by performing a coastdown test.

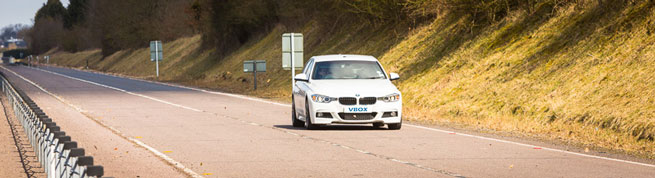
This is a test in controlled conditions which measures the effects of wind and road resistance, based upon time taken for a vehicle to coast from one speed to another, with the engine in neutral gear.

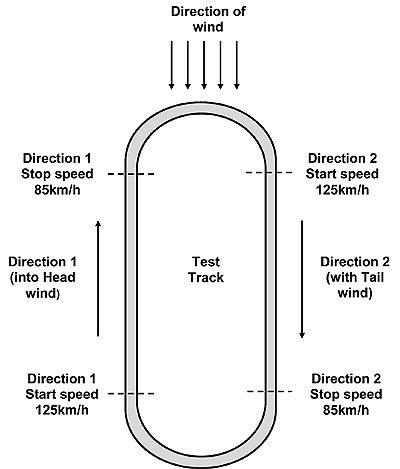
A major problem associated with this testing is the requirement for a very long, flat test track, to allow sufficient time for the vehicle to coast from 125 km/h to 5 km/h (for example – range is user definable).

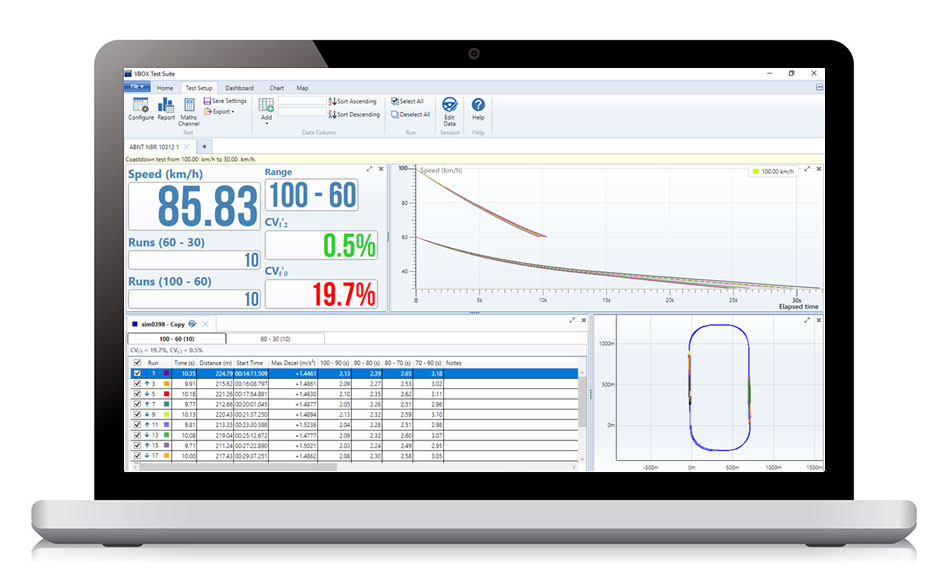
RACELOGIC has developed plugins for VBOX Test Suite to ensure that coastdown tests are repeatable and accurate. You can choose between three tests, the European WLTP GTR15, the American SAE J2263 and the Brazilian ABNT NBR 10312.

All tests enable you to break down the testing into multiple user-definable segments, to allow the full range to be subject to the test without the need for an excessively long test track.

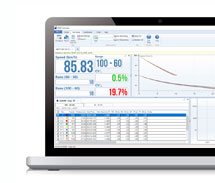
Statistical analysis can be performed in real time, to provide an immediate indication of when the required statistical accuracy has been met.

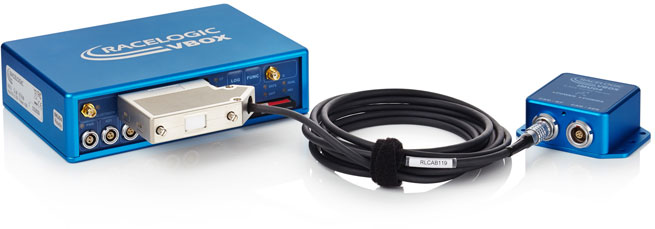
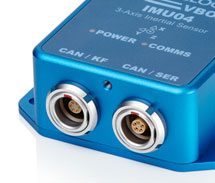
GPS/IMU integration for smoother accurate speed leads to more consistent results and shorter test time.

KEY FEATURES
  • Simple to set-up and use
  • Dedicated software plugins developed in accordance with European, US and Brazilian directives (WLTP GTR15, SAE J2263, ABNT NBR 10312).
  • IMU integration for precise data in noisy GPS conditions
  • User definable test range(s)
  • Clear indication of required accuracy – no complicated data processing required

DEDICATED SOFTWARE PLUGINS FOR COASTDOWN

VBOX Test Suite offers three Coastdown tests, the European WLTP GTR15, the American SAE J2263 and the Brazilian ABNT NBR 10312.

A velocity graph screen gives you a real time indication of your speed, along with a large, easy to read numerical display and clear indicators of the test status.

The table of results is updated with the coastdown times for each of the user defined increments in the test range, in both directions and with data for the average of these, the running average and the running standard deviation. For more information on each coastdown test see VBTS Coastdown.


Screenshot of VBOX Test Suite showing a coastdown test conducted in accordance with ABNT NBR 10312.


IMU INTEGRATION

VBOX 3i features IMU integration, meaning that it has the ability to combine GPS and inertial data from a RACELOGIC Inertial Measurement Unit in real-time.

Containing three accelerometers in the X, Y and Z planes, measurements from the IMU are seamlessly blended with the GPS data. This is useful for producing smooth, accurate data, particularly if you have a test site where view to the sky is obstructed, such as close to bridges, tall buildings and trees.


VBOX 3i

The 100Hz data logger has the ability to utilise data from a RACELOGIC IMU to improve all parameters measured in real-time – improving accuracy and noise levels, and enhancing the dynamic response to velocity.

IMU integration also combats satellite drop out up to 10 seconds without lock.


Inertial Measurement Unit

Racelogic’s IMU (RLVBIMU04) provides highly accurate measurements of pitch, roll, and yaw rate using three rate gyros, as well as x, y, z acceleration via three accelerometers.


VBOX Test Suite – Coastdown

Coastdown plugins within VBOX Test Suite help you to perform tests in accordance with EU, US and Brazilian Coastdown standards (WLTP GTR15, SAE J2263, ABNT NBR 10312).

The Coastdown test is performed in accordance with European Directive 70/220/EEC – Annex III and is based upon statistical evaluation of a minimum of 4 test runs.

The test can be performed at any speed according to the manufacturer’s requirements, but must follow the general procedure below:

  • Step 1: Accelerate the vehicle to a speed 10kph greater than the test start speed (user definable – 125kph in the opposite diagram).
  • Step 2:  Place gearbox in neutral.
  • Step 3: Measure the time taken for the vehicle to decelerate from the start speed to the stop speed (user definable – 85kph in the diagram).
  • Step 4: Repeat steps 1-3, but in the opposite direction.
  • Step 5: Take the average time of these two runs.
  • Repeat steps 1 to 5 until such time that the statistical accuracy of the average values is not more than 2% (minimum 4 tests required). Note: The software performs the calculations required to assess statistical accuracy.
pattern
https://www.zenmicrosystems.co.in/wp-content/themes/blake/
https://www.zenmicrosystems.co.in//
#ef3e35
style3
paged
Loading posts...
/home/zenmicrosystemsc/public_html/
#
on
none
loading
#
Sort Gallery
https://www.zenmicrosystems.co.in/wp-content/themes/blake
on
no
off
ENTER YOUR EMAIL HERE!
off
off