TEST PROCEDURES
In order to establish the vehicle heading to base the deviation calculation on, data is sampled in the short time before the centre line deviation test. This means that the test engineer can drive in any direction accross the test pad,
as long as the vehicle is kept in a straight line before letting go of the steering wheel.
This is useful for different proving ground layouts, and means that tests can take place in a variety of locations. To maintain accuracy, any runs in which the heading before the start of the test was not within user-defined tolerances during the averaging period are highlighted.
Test Procedure Example
- The test driver sets the start or end line and centreline distance
- Test driver proceeds to the start position, attempting to maintain a constant heading
- The centreline is calculated during the averaging period (if the deviation is too high the test is aborted)
- The centre line and start speed are then updated on the screen, the status displays ‘test started’ and the software beeps
- During the test the centre line distance, centre line deviation, end speed, and average speed are updated every sample and shown in the live window
- The tests ends on a GPS end line or pre-defined centreline distance, and the final results are displayed.
How does it work?
Commonly used for applications such as measuring side wind susceptibility, and vehicle deviation during various manoeuvres; the centre line deviation function can be used to show the deviation of a vehicle from a specified centre line to an accuracy of between 1 and 2cm (over a 30 second time period).
The high accuracy, Doppler derived velocity channels are measured and used to determine the lateral deviation from a specified track heading at every sample using geometric theories. This calculated deviation (lateral displacement) is an accumulative distance measurement, so it is most accurate when measured over short periods of time.
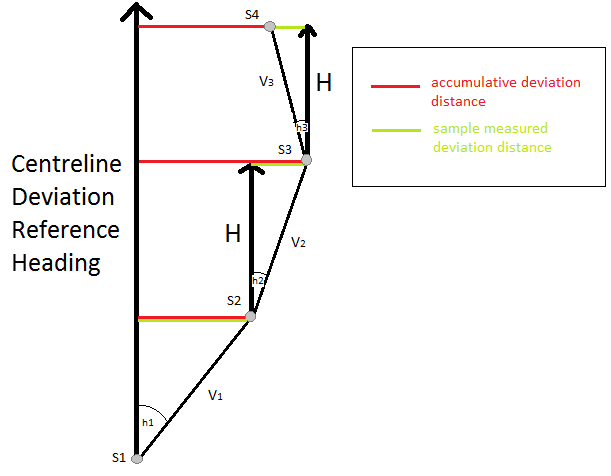
The above diagram simply displays how the accumulative deviation from a given centre line (H) is calculated.
Once the centre line deviation value starts calculating (S1), it will initially take the heading value recorded by the Doppler shift, and create a heading difference value (h1), relative to the defined Centre line deviation heading. Knowing the velocity at which the vehicle was travelling between samples (v) allows a sample measured deviation distance to be accurately determined. Using trigonometric relationships, this deviation distance is calculated using the following equation.
(Sin (heading diff) * Speed (m/s))*sample time
For successive samples a heading difference is then determined by comparing the current heading sample to the one previous.
The sample measured deviations are then accumulated throughout the test to produce a final centre line deviation result.